Side by side comparison of natural and thermal view of the twin cities: images taken on 19 August 2021
Introduction
The goal of this study is to analyze the heat distribution under various land-use conditions in Rawalpindi and Islamabad. Broadly speaking, land use could be classified into five types: Developed, Agriculture & Horticulture, Forest, Water, Barren. Because of limited local weather stations that monitor the air temperature, we have to rely on satellite imagery. Landsat 8 images dated 19th Aug 2021 were used in this study.
Methodology
In this section, the basic methodology is explained. You may jump ahead to analysis and results.
Overview
Band 10 and Band 11 in Landsat 8 are surface temperature bands. For this case, Mono-Window Algorithm was used to extract lands surface temperature, which although not very accurate, suited well to this basic heat distribution study.
All the processing was done in ESRI ArcGIS.
Model
To make the processing easier, a model was created inside the ArcGIS. You can download the toolbox here.


Using this model, we get this heat map.

Classification
Supervised classification is run to identify various land uses.

The resulting raster is then processed by filtering smaller pixels, smoothing class boundaries, and removing isolated regions, which is then converted to polygon.

Analysis
From the land-use classification, we can see that Agriculture/Horticulture is the leading land use in the twin cities.
-
Agriculture/ Horticulture 3,722 Square Kilometer
-
Barren 1,172 Square Kilometer
-
Forest 618 Square Kilometer
-
Developed 554 Square Kilometer
-
Water 27 Square Kilometer
Now that the required layers are here, we can begin analyzing urban areas to locate heat islands.
In hindsight, we can see that Rawalpindi is significantly hotter than Islamabad.

Exploring the mapped region, we look for areas of interest.
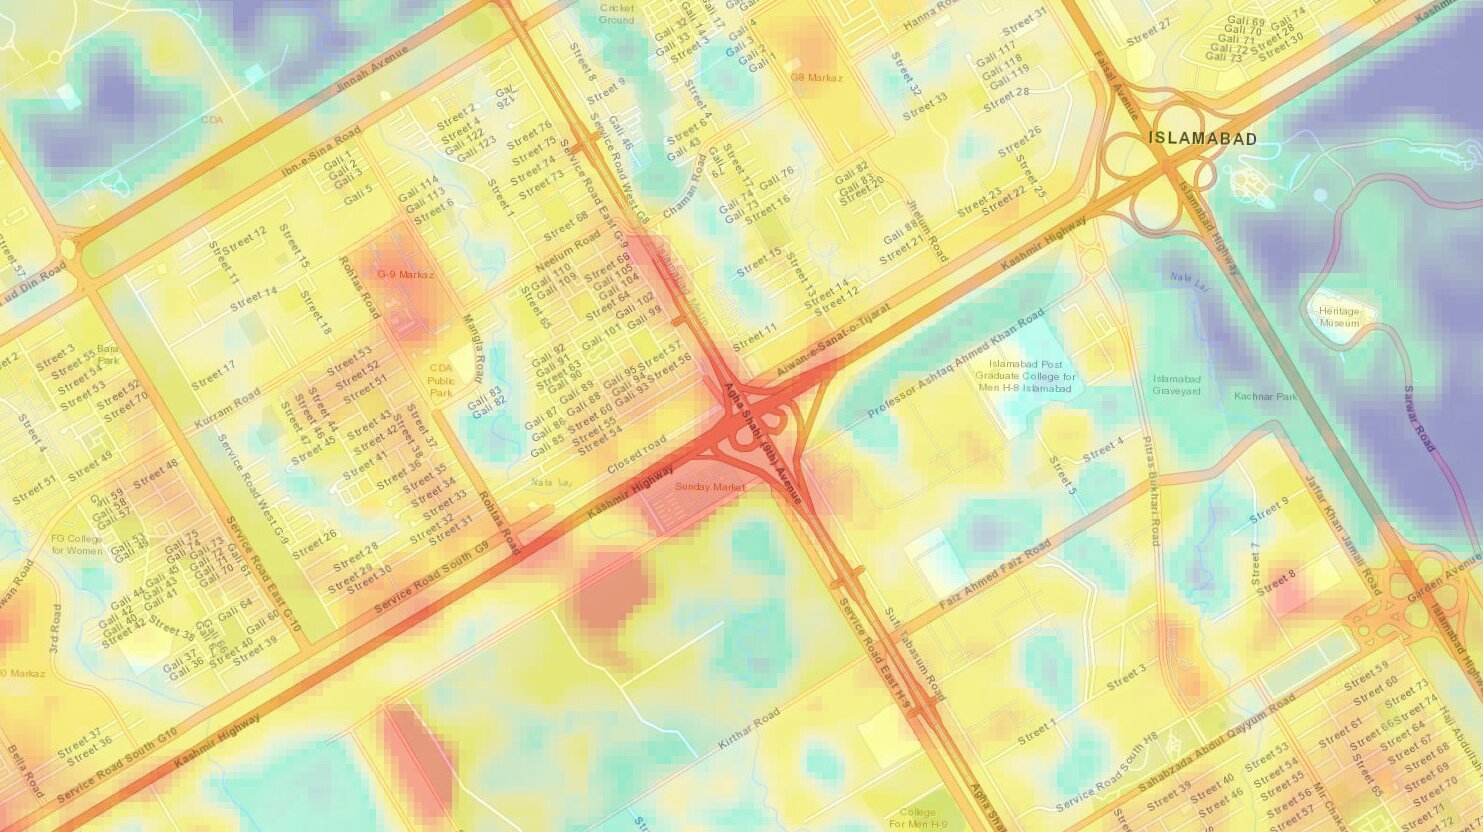
The surface temperature of above regions is 3-5 Degree Celsius higher than mean surface temperature.
These regions are particularly interesting because of large temperature gradient with their surrounding.
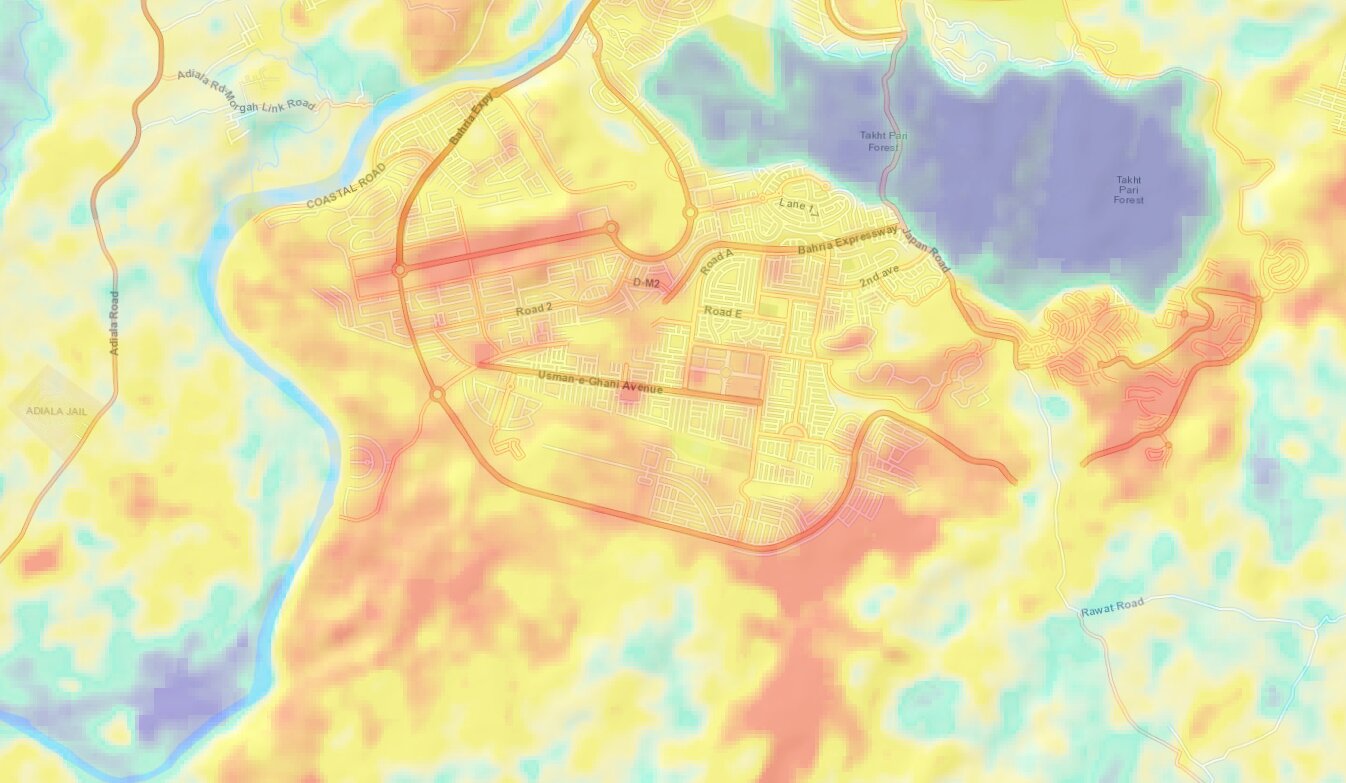
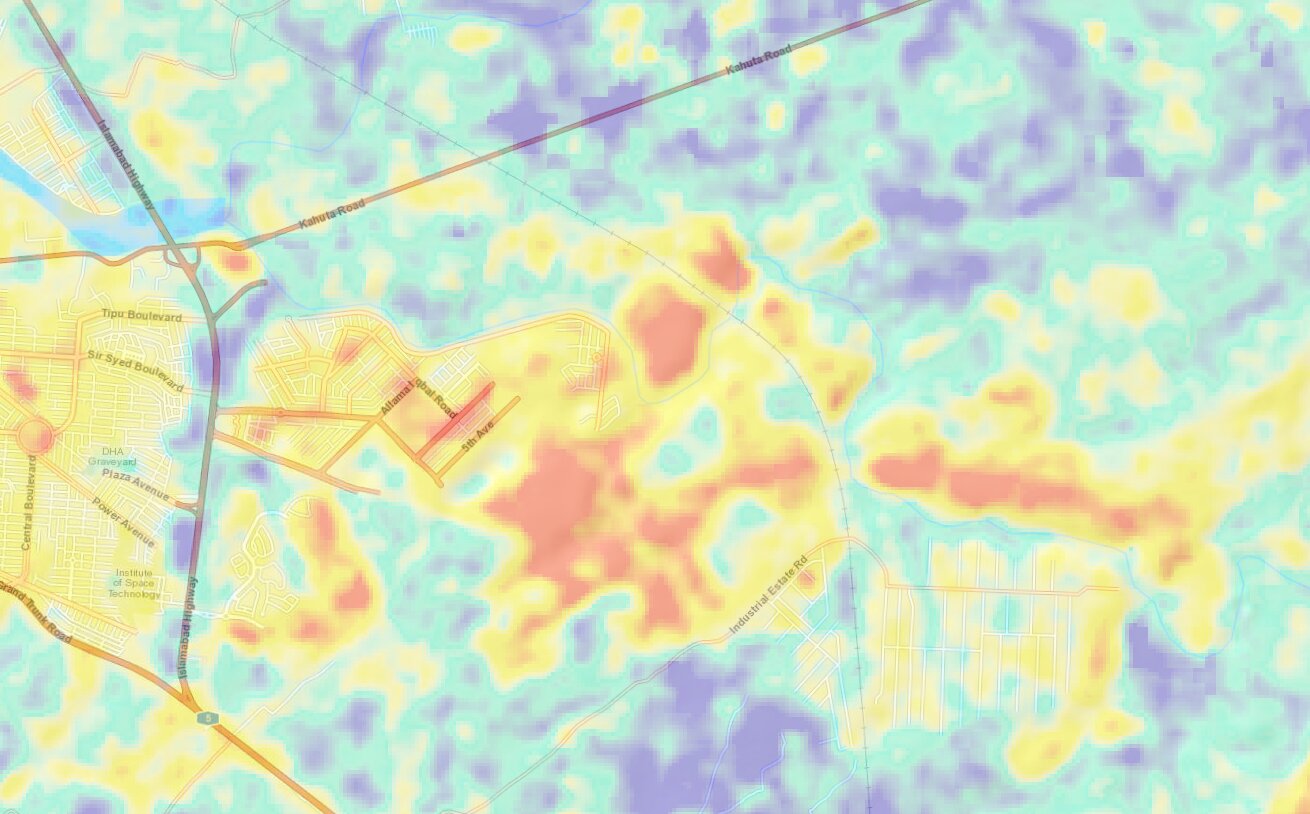
Bahria Town, Rawalpindi:
Although not very congested, it is a newly developed satellite town with plenty of uncovered lands, causing a very high surface temperature at the lower end. Other areas have relatively high mobility as well as a commercial activity, which appear as red spots. Perhaps the most exciting feature of this area is the deep blue bulge on the upper-right corner, manifested by a small natural forest. This high contrast is because of the high-temperature difference. Overall, the land surface temperature varied between 60-70 degrees.
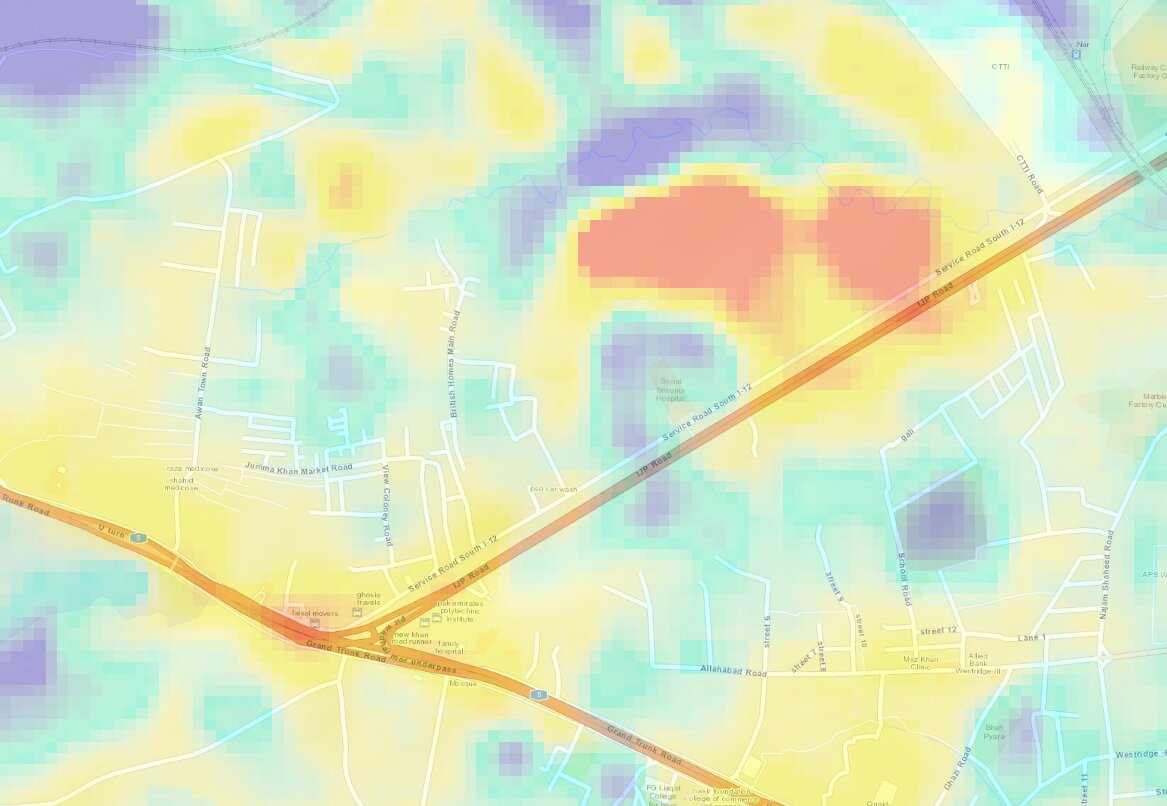
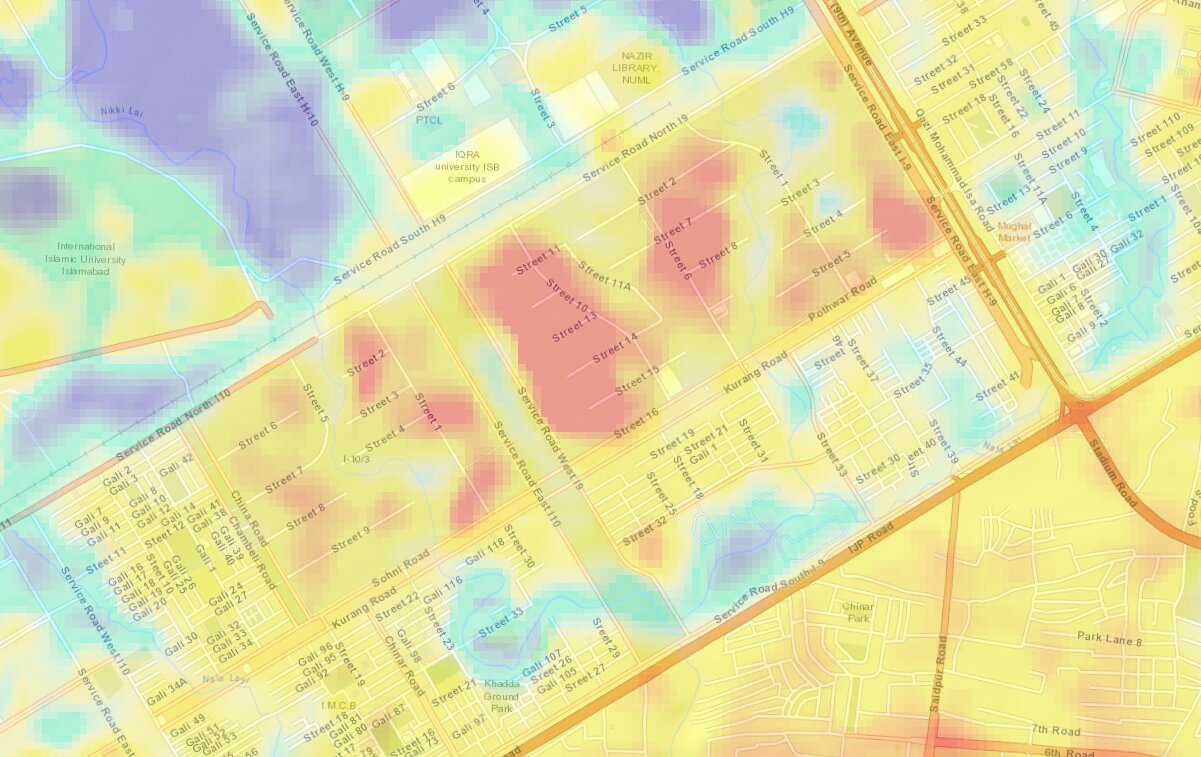
Industrial State, I9 Islamabad:
I9, Islamabad is a mixed land-use sector with urban, commercial, and small industrial units. Residential units are not too dense and are provided with adequate green spaces.In this map, we see heat islands centered at the industrial units. On the upper right corner, there is natural vegetation that helps regulate nearby temperatures. Overall, the surface temperature varied from 62-71 degrees
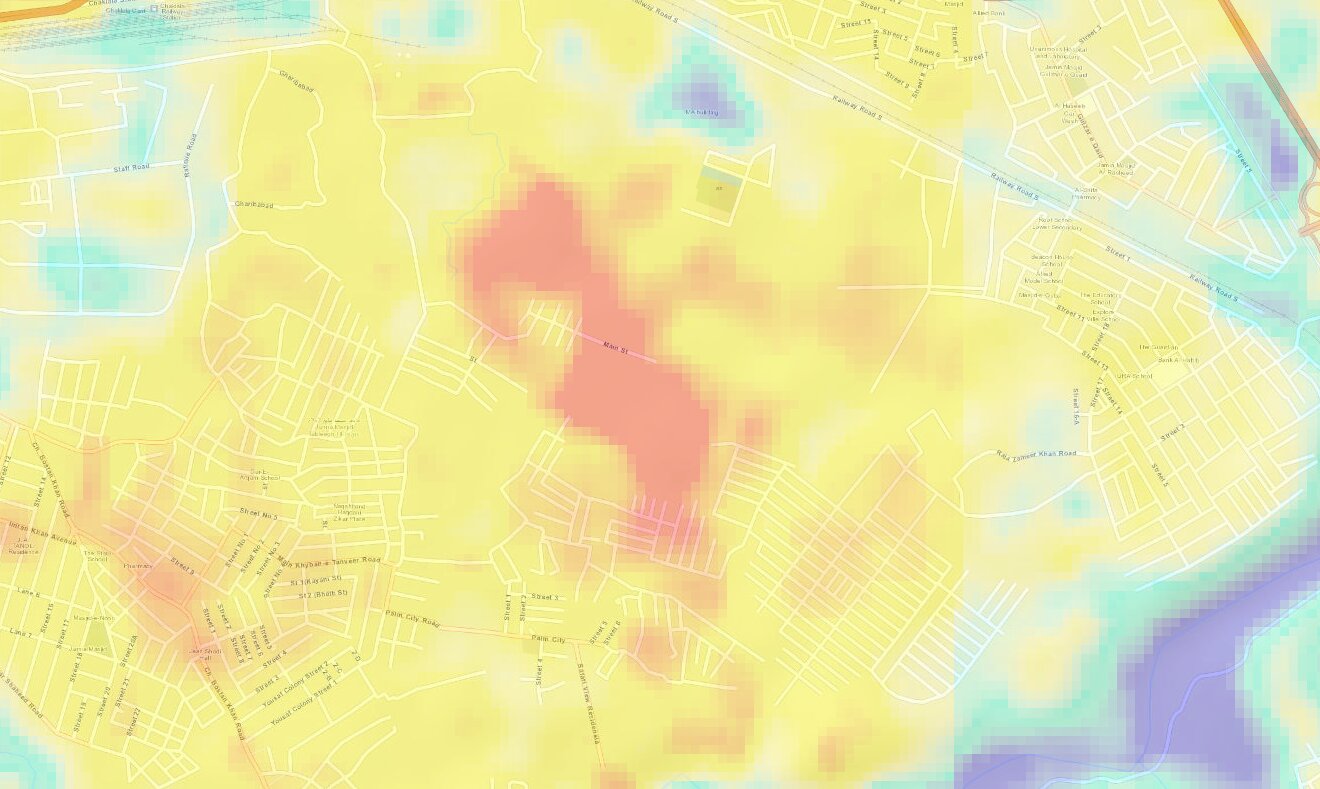
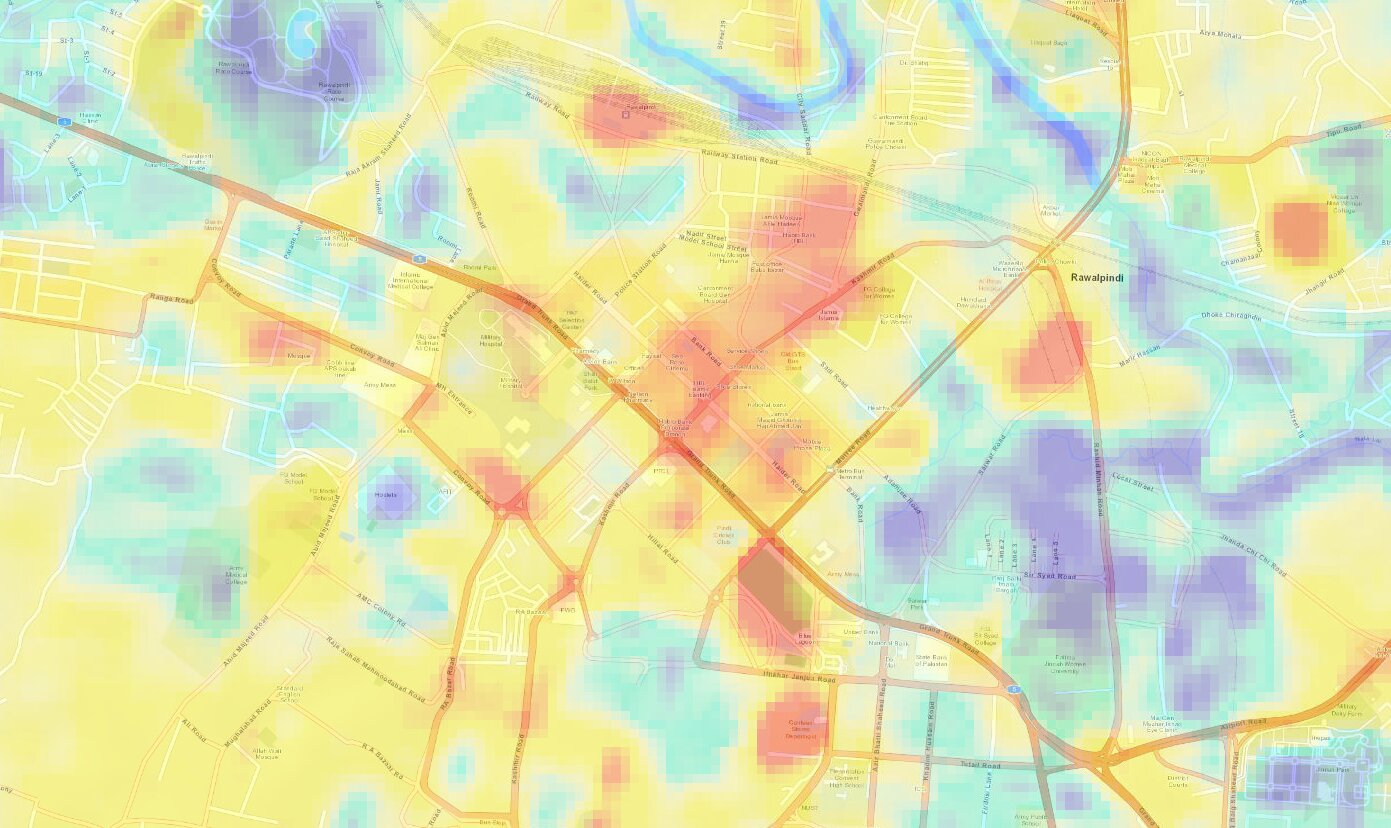
Saddar, Rawalpindi
This is the commercial center of Rawalpindi, bringing in thousands of daily customers and their vehicles. We see the most crowded parts of this market in the red.On the periphery, there is a cool gradient, which is because of large public parks. Here the surface temperature varied from 64-70 degrees.
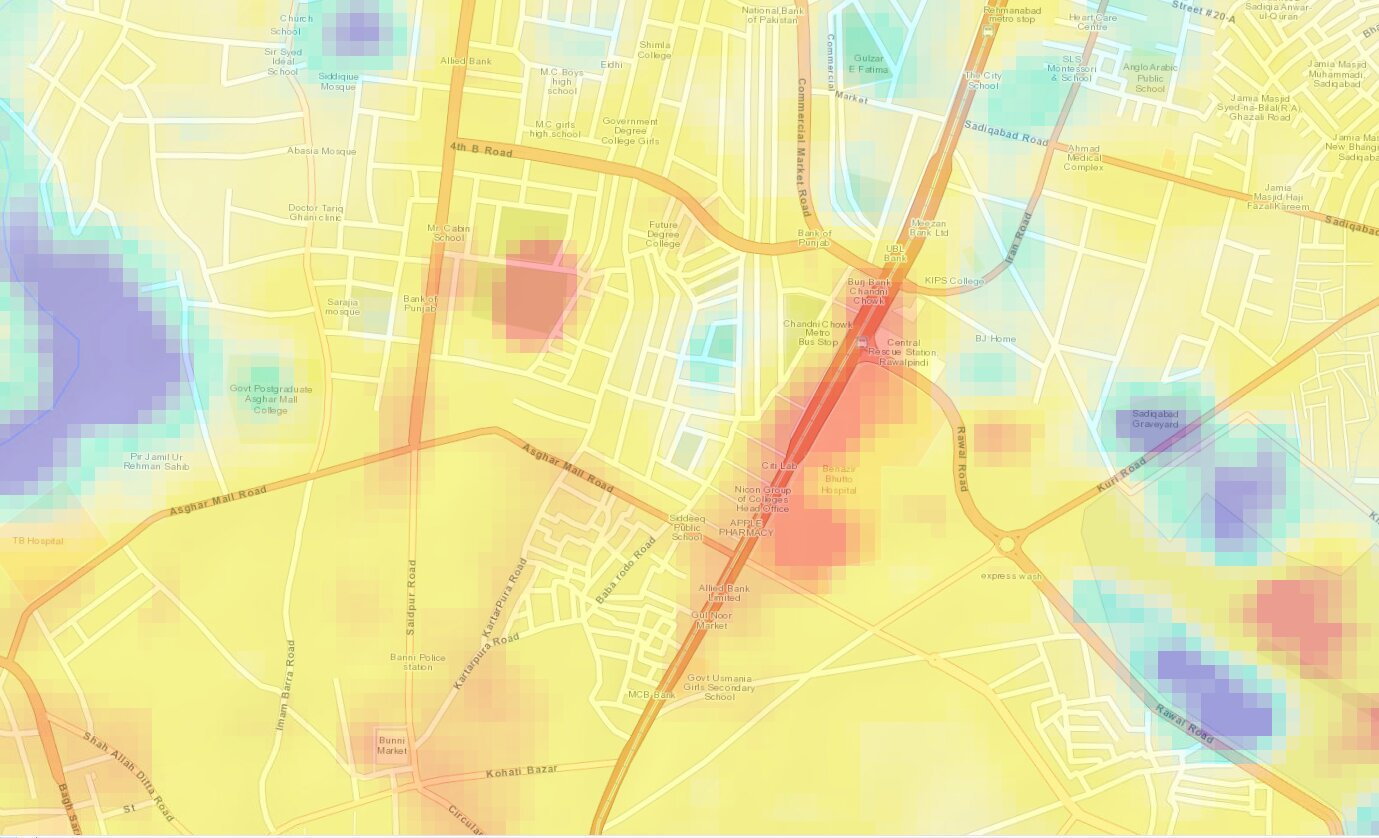
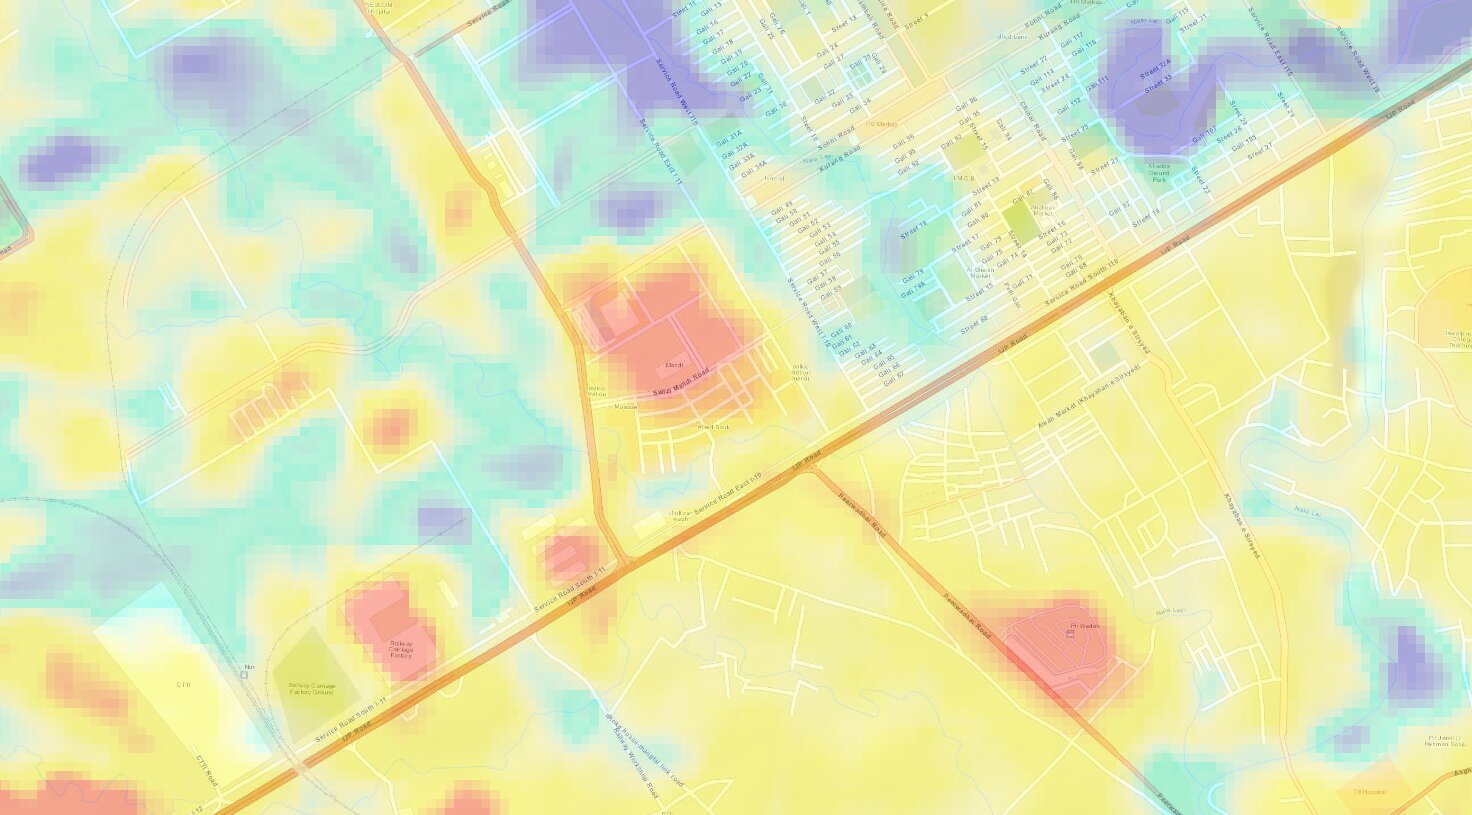
Chandni Chowk, Rawalpindi
This is the busiest area in Rawalpindi city, having a dense urban population on both the sides of roads and large commercial units. Overall the surface temperature was higher, with only moderate cooling at some spots caused by public parks and roadside plantations. The temperature varied from 63-71 degrees.
Inaccuracy
Land Surface Temperature is generally higher for bare soil, rocks, and buildings, while lower for green spaces and water bodies. Although our model provides an accurate temperature distribution, temperature values for water bodies and green spaces were higher than expected. This is because of the resolution of Landsat8 Band 10 (Thermal Band) images, which is only 100m. The calculation averages the pixel temperature on a 100-meter area, but the canopy of an average tree is only about 5-meters, causing a much higher value for the green covers.
Further Research
These initial results show that surface temperature is greatly affected by land-use type. Barren soil or bare land has the highest temperature, followed by developed land and agriculture/horticulture, and the water bodies and dense forests have the lowest surface temperatures.
This study opens new research avenues that could help better urban climate:
-
Land Surface temperature for past 15-20 years could be generated in the same manner to understand Urban growth, and resulting weather extremes.
-
Since the current model only used natural imagery to classify land, it might not be very accurate, and for better results, DEMs may also be incorporated.
-
By fixing weather poles at particular points in the above regions, a very detailed map of Urban Heat islands could be created.
Author: Syed Abdul Rafay